Mar 5, 2025
Restaurant Management Checklist Examples
---

Managing a restaurant involves a multitude of responsibilities, from ensuring smooth daily operations to engaging customers and maintaining food safety standards. To streamline these tasks, restaurant managers can rely on comprehensive checklists that cover every aspect of their duties. This article explores various checklists that can aid in efficient restaurant management and highlights strategies to eliminate profit killers, enhance customer engagement, and leverage technology for better performance tracking.
Key Takeaways
- Restaurant managers have a wide range of responsibilities including daily operations, staff management, and financial oversight.
- Essential checklists for restaurant operations include opening, closing, and daily cleaning routines.
- Implementing effective food safety practices is crucial and involves proper purchasing, storage, handling, and preparation of food.
- Identifying and eliminating profit killers through accountability and continuous improvement techniques can significantly enhance profitability.
- Utilizing technology such as real-time data, digital checklists, and performance tracking systems can greatly improve management efficiency.
Key Responsibilities of Restaurant Managers
As a restaurant manager, you play a crucial role in ensuring the smooth operation of both the front-of-house (FOH) and back-of-house (BOH) areas. Your responsibilities encompass a wide range of tasks that are essential for maintaining high standards and achieving business goals.
Essential Checklists for Restaurant Operations
A restaurant operations checklist acts as a comprehensive guide to ensure smooth daily functions. These checklists are crucial for maintaining consistency and avoiding errors. Each section of your restaurant, from the kitchen to the dining area, should have its own specific checklist to cover all necessary tasks. Regularly updating and reviewing these checklists can help identify areas for improvement and ensure all staff are aligned with operational standards. Additionally, using digital tools to manage checklists can enhance efficiency and make it easier to track completed tasks.
Restaurant Management Checklist Examples
Effective restaurant management is essential for maintaining smooth operations, providing exceptional customer service, and ensuring compliance with safety regulations. Checklists are a critical tool for restaurant managers to streamline tasks, maintain consistency, and identify areas for improvement. Below, we've expanded on various types of checklists you can use in your restaurant, complete with examples of questions for each.
Why Checklists Matter in Restaurant Management
Checklists are a proven way to:
- Ensure compliance with health and safety regulations.
- Standardize operational procedures across shifts and locations.
- Improve team accountability and performance.
- Enhance the overall guest experience.
With the right checklist, restaurant managers can save time, reduce errors, and keep the business running smoothly. Visit our restaurant industry page to explore how our tools can streamline your operations.
Opening and Closing Checklists
Opening and closing checklists help ensure your restaurant is prepared for a successful day of service and is properly secured at the end of the day.
Examples of Opening Checklist Questions:
- Is the dining area clean, organized, and ready for guests?
- Have all kitchen appliances been inspected and turned on?
- Is the point-of-sale system operational and stocked with supplies?
- Are bathrooms cleaned, stocked, and functional?
- Have deliveries been checked and stored appropriately?
Examples of Closing Checklist Questions:
- Have all perishable items been stored correctly?
- Are kitchen surfaces cleaned and sanitized?
- Have all trash bins been emptied and properly disposed of?
- Is the cash register balanced, and deposits prepared?
- Are all doors, windows, and alarms secured?
Explore more about opening and closing checklists.
[ Try checklist]
Food Safety Checklists
Maintaining food safety is critical to protecting your customers and your business from health violations. Food safety checklists help ensure that all health regulations are met consistently.
Examples of Food Safety Checklist Questions:
- Are refrigerator and freezer temperatures within the safe range?
- Is all food properly labeled and dated?
- Are handwashing stations stocked with soap and paper towels?
- Are raw and cooked foods stored separately to avoid cross-contamination?
- Have all food prep surfaces been sanitized?
[ Try checklist]
Learn more about how our food safety checklists can protect your restaurant.
Customer Service Checklists
Exceptional customer service is key to building loyalty and ensuring repeat business. A customer service checklist helps your team deliver a consistently excellent experience.
Examples of Customer Service Checklist Questions:
- Are all staff members in proper uniform and ready to greet guests?
- Are reservation systems updated and functioning?
- Are menus clean, updated, and free of wear?
- Have staff been briefed on any special promotions or menu changes?
- Are guest complaints or feedback from the previous day reviewed and addressed?
[ Try checklist]
Visit our customer service checklist page for more insights.
Inventory Management Checklists
Keeping track of inventory ensures you have the supplies needed to operate smoothly while minimizing waste and controlling costs.
.webp)
Examples of Inventory Checklist Questions:
- Have all stock levels been updated in the inventory system?
- Are storage areas clean and organized?
- Are expired items identified and removed?
- Is there an adequate supply of non-perishable and paper products?
- Have recent deliveries been cross-checked with purchase orders?
[ Try checklist]
Streamline your inventory process with our restaurant management tools.
Maintenance and Safety Checklists
Regular maintenance and safety checks are vital for preventing accidents and ensuring smooth operations.
Examples of Maintenance Checklist Questions:
- Are fire extinguishers inspected and accessible?
- Are all lights and electrical outlets functioning?
- Are floors, walls, and ceilings free of damage or hazards?
- Is kitchen equipment in proper working condition?
- Are emergency exits clear and properly marked?
[ Try checklist]
Keep your restaurant safe and compliant with our maintenance and safety checklists.
FAQs
Why are checklists important for restaurants?
Checklists ensure consistency, compliance, and efficiency in daily operations, helping to minimize errors and improve guest satisfaction.
How often should checklists be updated?
Checklists should be reviewed regularly and updated as needed to reflect changes in operations, health codes, or menu offerings.
Can checklists help reduce staff training time?
Yes, checklists provide clear, step-by-step instructions that make onboarding and training new staff more efficient.
Implementing Effective Food Safety Practices
Ensuring food safety in your restaurant is crucial for maintaining customer trust and avoiding violations. Here are several key areas to focus on to implement effective food safety practices:
- Comprehensive Training Program: Develop a thorough training program for all staff members. This should cover every aspect of food handling, from purchasing and receiving to storage, preparation, and service. Ensure that your staff is well-versed in proper food safety protocols and understand the importance of adhering to them.
- Proper Purchasing and Receiving: Establish clear guidelines for purchasing and receiving food products. This includes checking for proper temperatures, signs of contamination, and the integrity of packaging. Only source ingredients from reputable suppliers who follow stringent safety standards.
- Safe Storage Practices: Implement safe storage practices to maintain the quality and safety of your food. This involves keeping food at the correct temperatures, using proper labeling and rotation methods to ensure first-in, first-out (FIFO) usage, and preventing cross-contamination by storing raw and cooked foods separately.
- Hygienic Food Preparation: Ensure that food preparation areas are kept clean and sanitized at all times. Staff should follow proper handwashing techniques, use clean utensils and equipment, and regularly sanitize surfaces. Implementing these measures reduces the risk of contamination and foodborne illnesses.
- Correct Cooking and Serving Procedures: Ensure that food is cooked to the appropriate temperatures to kill harmful bacteria. Use food thermometers to verify that internal temperatures meet safety guidelines. When serving food, maintain hygiene by using clean serving utensils and preventing cross-contamination.
- Ongoing Monitoring and Evaluation: Regularly monitor and evaluate food safety practices in your restaurant. Conduct routine inspections, provide refresher training for staff, and stay updated on the latest food safety regulations and guidelines. Continuous improvement is key to maintaining a safe dining environment.
By adopting these effective food safety practices, you can greatly minimize the risk of foodborne illnesses and provide a secure dining environment for your customers. This approach not only safeguards your patrons but also boosts your restaurant's reputation and ensures sustained success.
Related: How to Implement Management by Checklist with follow-up in your Restaurants
Marketing and Customer Engagement Checklists

A marketing checklist for your restaurant might include updating and maintaining your professional website, engaging with local SEO, and staying active on social media. The success of a restaurant is not only about operations but also about attracting and retaining customers. A marketing and promotions checklist will help to guide effective marketing strategies, promotions, and updating menus or displays. By regularly monitoring and ticking off marketing efforts, you can maintain a consistent and effective promotional strategy.
Related: Really Know Your Customers And What They Want
Strategies to Eliminate Profit Killers
Identifying Common Profit Killers
Understanding what constitutes a profit killer is essential for any restaurant manager. These are controllable business expenses that erode profits due to a lack of managerial attention or action. For instance, inefficient inventory management can lead to excessive waste, which directly impacts your bottom line. Proactive management and optimization are key to mitigating these costs.
Accountability Measures
Holding individuals accountable for managing specific costs is crucial. By assigning responsibility to team members, you create a clear chain of accountability. This approach not only helps in identifying areas of waste but also fosters a culture of continuous improvement. Tools like OpsAnalitica provide real-time data and insights, enabling greater visibility into expenses.
Continuous Improvement Techniques
Continuous improvement is vital for eliminating profit killers. Regularly analyzing data and identifying trends can help you refine your processes over time. Implementing robust management systems allows for the tracking of progress against predefined targets, ensuring that profit killers are addressed promptly. This ongoing effort is essential for maintaining a healthy profit margin.

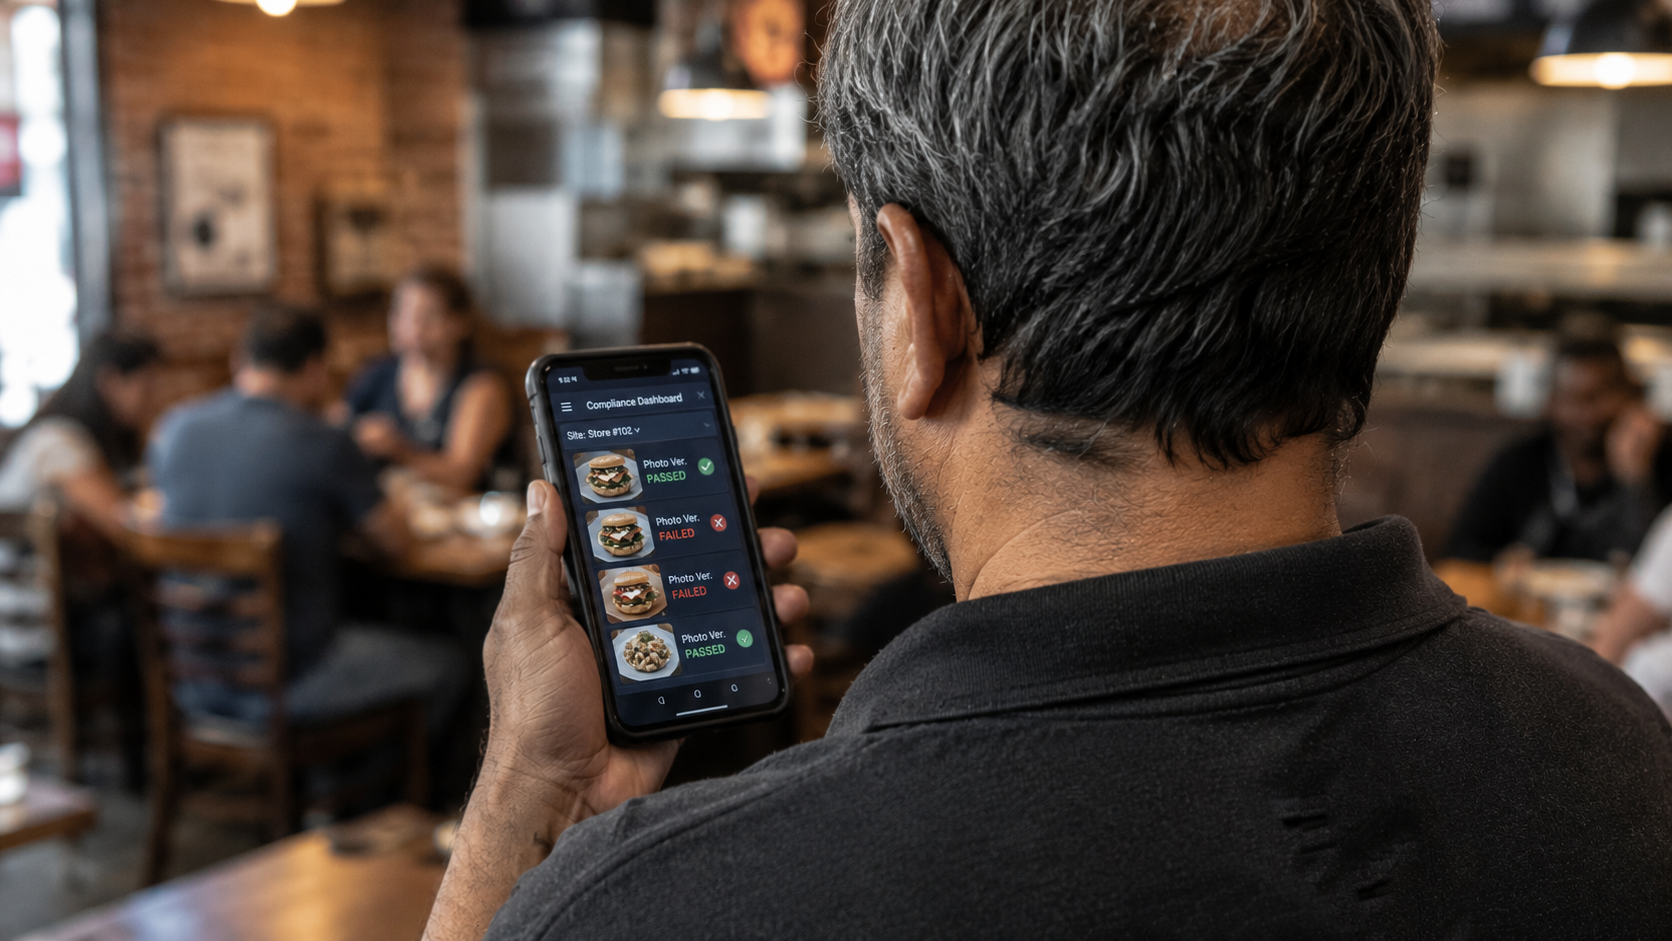
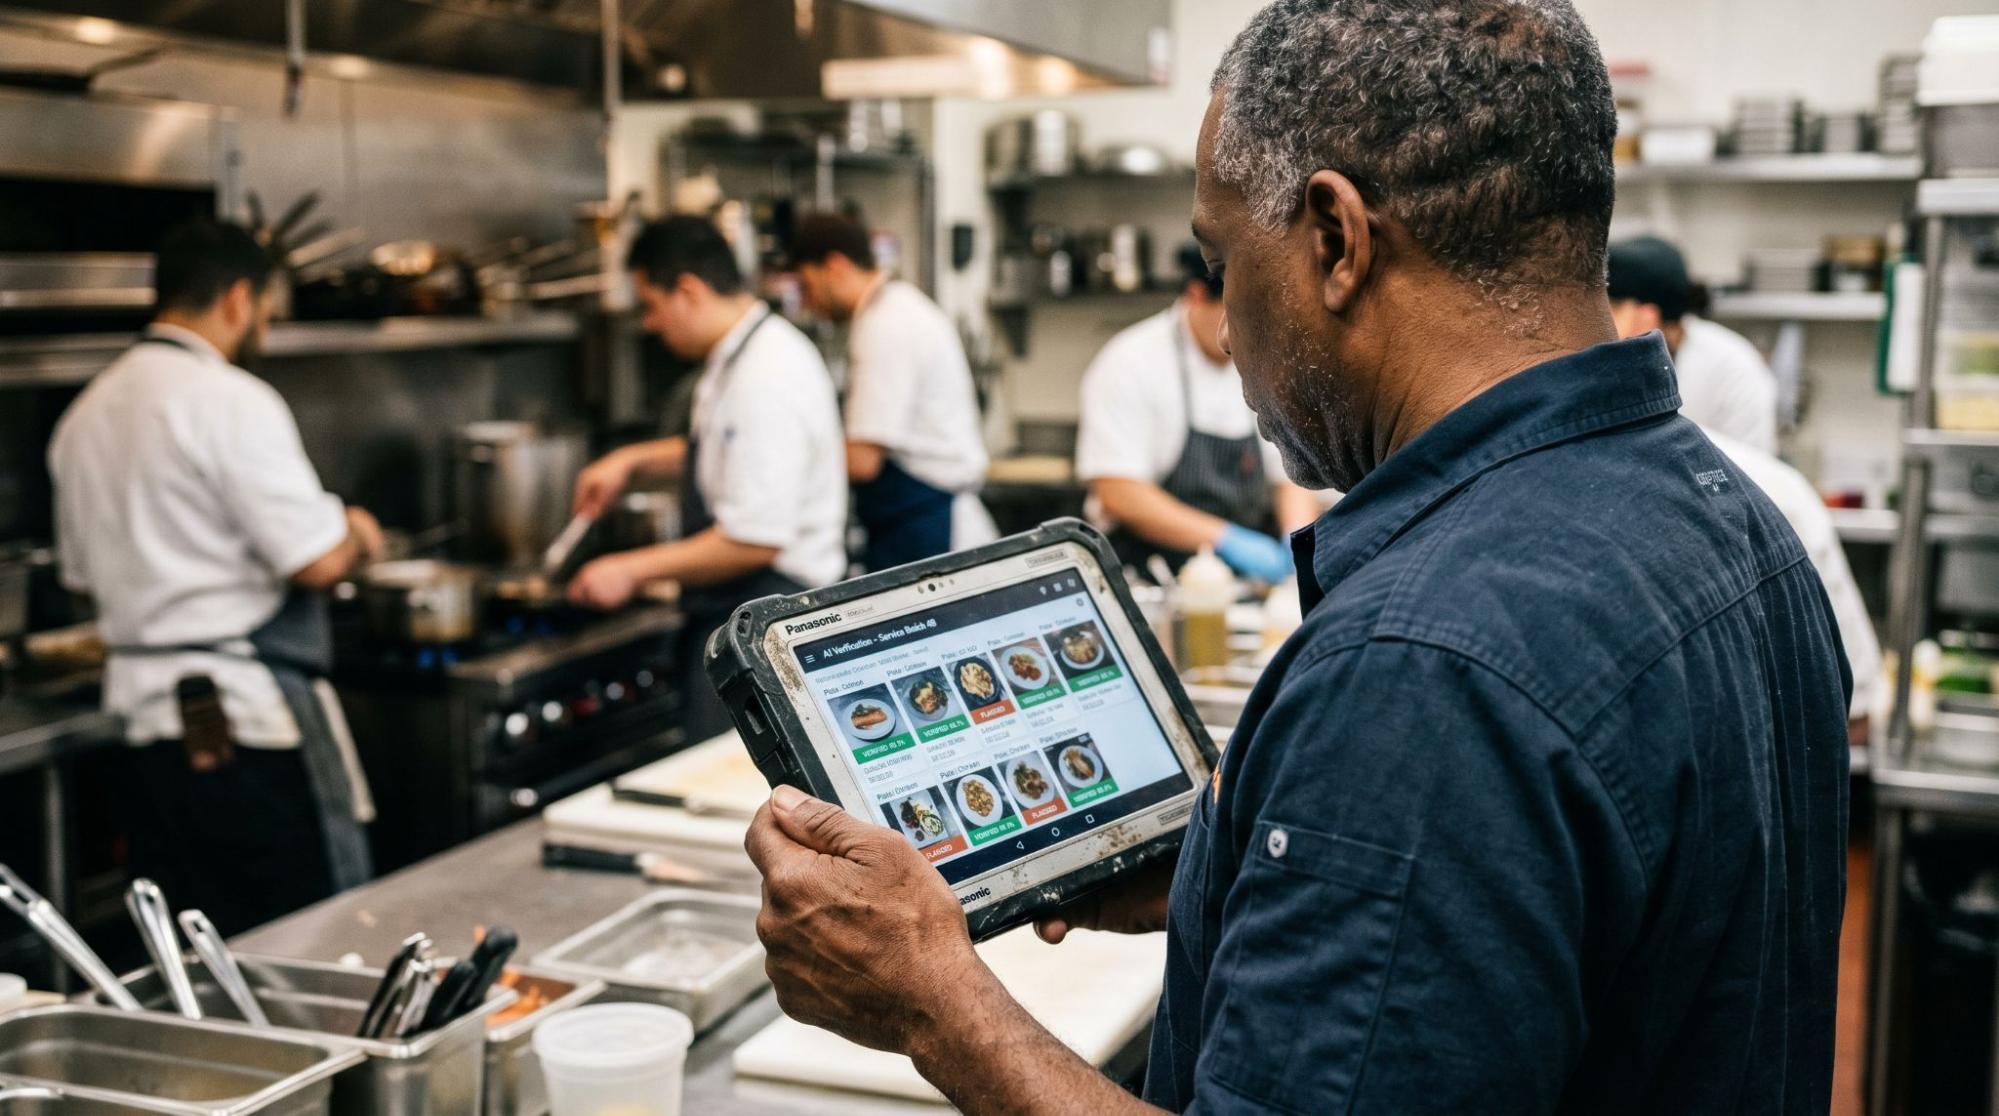
Utilizing Technology for Efficient Management
Incorporating technology into your restaurant management practices can significantly enhance efficiency and streamline operations. Real-time data and insights allow you to monitor various aspects of your business, from inventory levels to staff performance, ensuring that all your daily tasks are done on time for effective restaurant management. Digital checklists and tools provide a structured approach to managing daily operations, reducing the risk of human error and ensuring consistency. Performance tracking systems enable you to measure and analyze key metrics, fostering a culture of continuous improvement and accountability. By leveraging these technological solutions, you can implement management by checklist with follow-up in restaurants, ultimately leading to better restaurant operations.
In today's fast-paced world, leveraging technology is crucial for efficient management. Our platform offers AI Predictive Analytics tailored for various industries, ensuring you stay ahead of the curve. Discover how our solutions can transform your operations and drive success. Visit our website to learn more and schedule a demo today!
Conclusion

Effective restaurant management is pivotal to the success and profitability of any food service establishment. By implementing comprehensive checklists tailored to various roles and responsibilities within the restaurant, managers can ensure that all aspects of operations run smoothly and efficiently. Tools like OpsAnalitica can further enhance this process by providing real-time data, fostering accountability, and enabling continuous improvement. Ultimately, a well-structured management system not only helps in identifying and eliminating profit killers but also promotes a culture of excellence and operational integrity. By adhering to these best practices, restaurant managers can significantly improve their operational efficiency and drive long-term success.
Ready to Improve Your Operations?
Get our FREE checklists to streamline processes, boost efficiency, and save time.